The data of mass spectrometry (MS)-based proteomics is generally achieved by peptide identification through comparison of the experimental mass spectra with the theoretical mass spectra that are derived from a reference protein database. PGA constructs customized proteomic databases based upon RNA-Seq data and then novel peptides could be identified based on the database.
Firstly, the package PGA was used to construct the customized proteomic database based on RNA-Seq data. Then the MS/MS data was searched against this database. A refined FDR estimation approach for these identifications was employed.
Figure 1. Precusor ion error distribution.
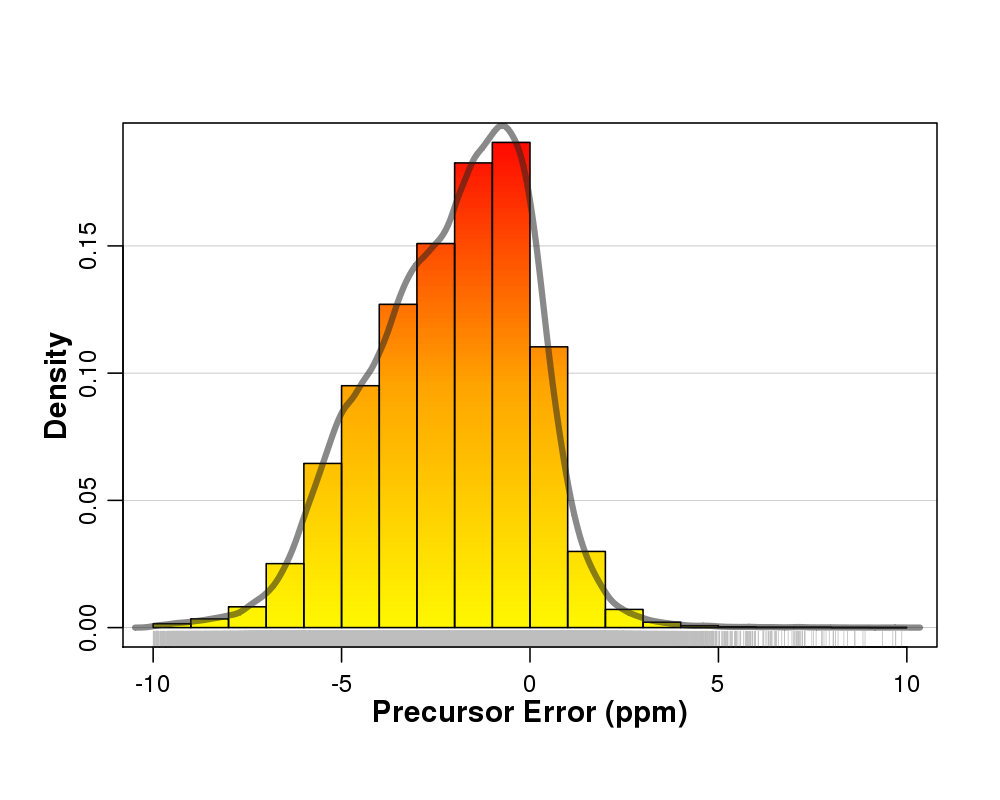
Figure 2. Unique spectrum per protein chart.
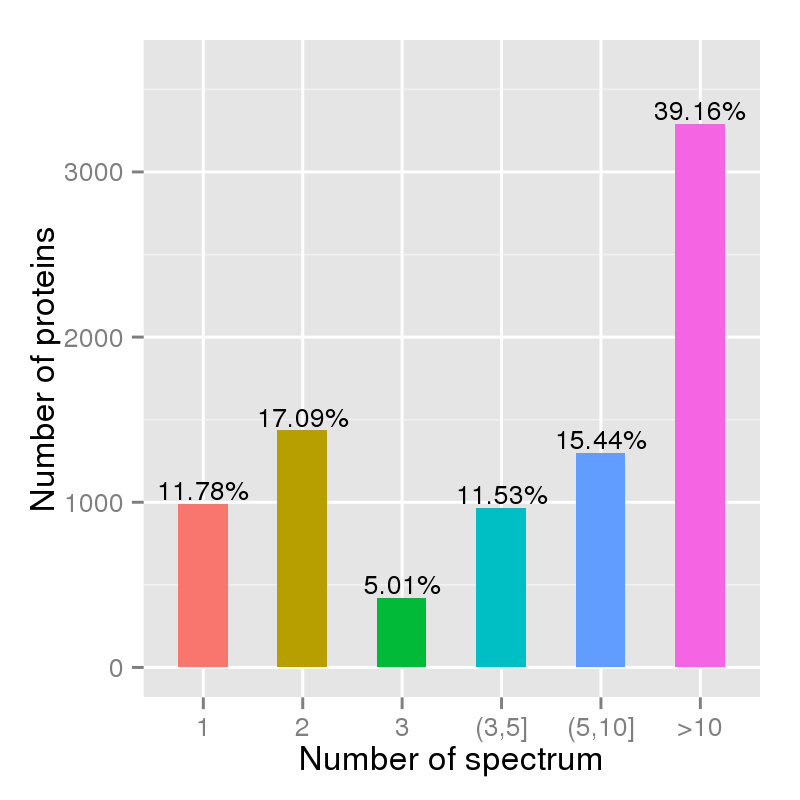
Figure 3. Unique peptide per protein chart.
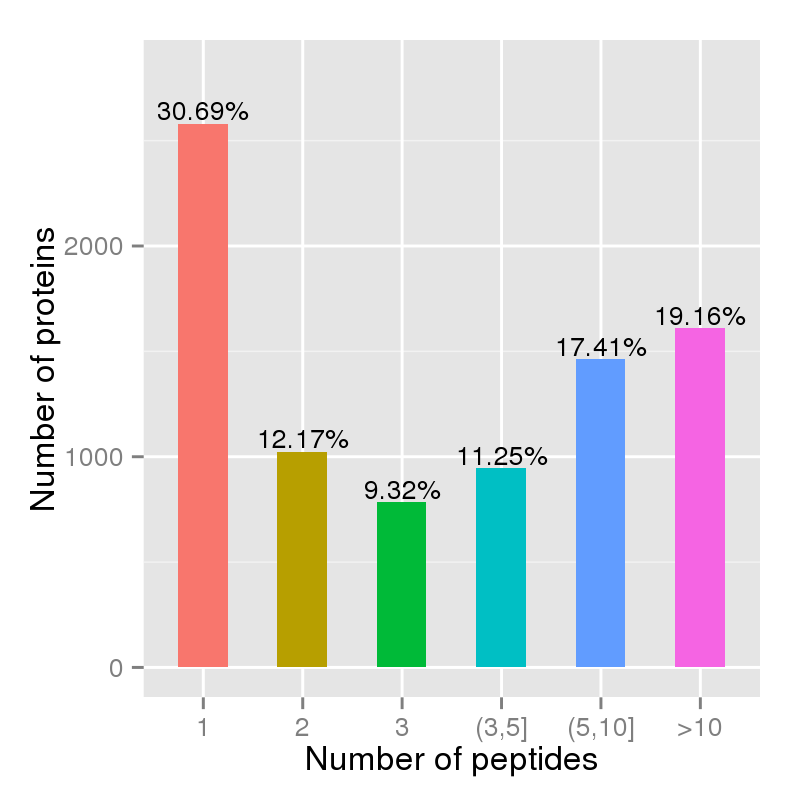
Figure 4. Comparison of charge distributions of canonical peptides versus novel peptides. All of the peptides were filterd with 1% false discovery rate.
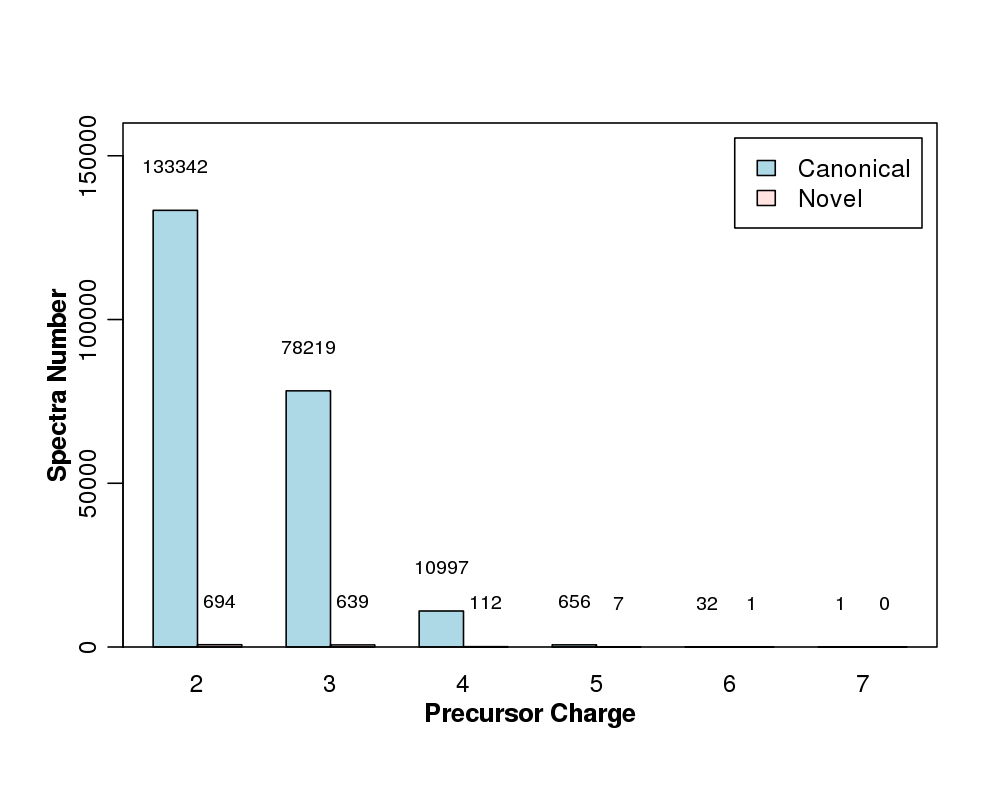
Figure 5. Comparison of score distributions of canonical peptides versus novel peptides. All of the peptides were filterd with 1% false discovery rate.
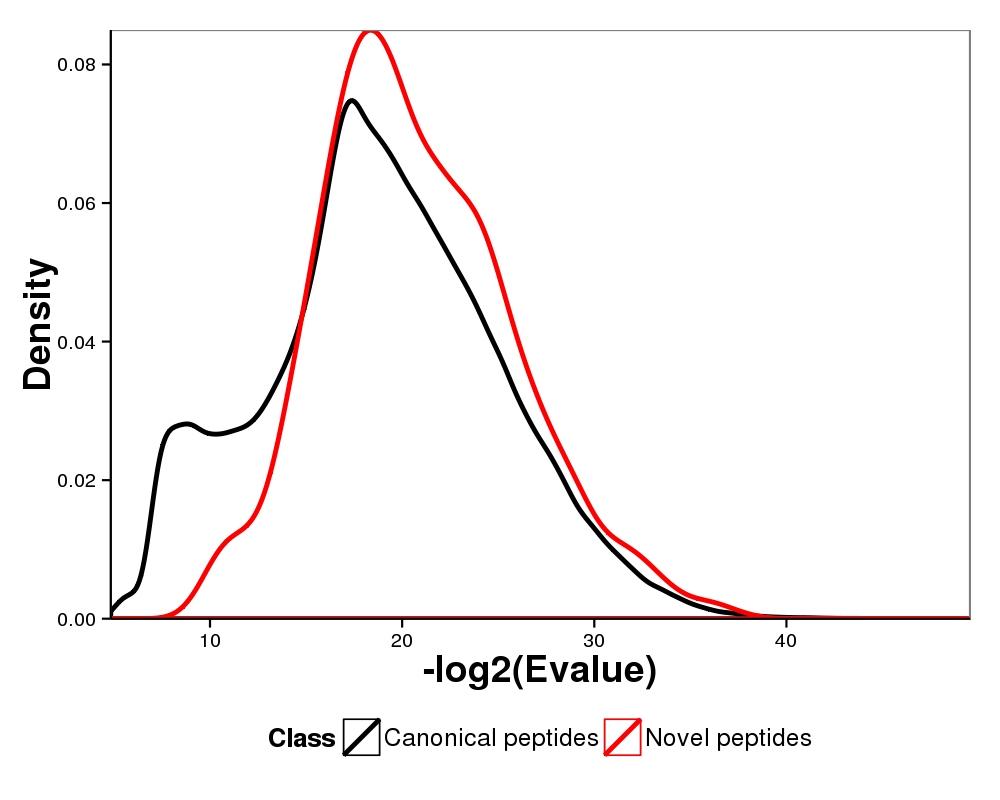
Figure 6. Comparison of mass distributions of canonical peptides versus novel peptides. All of the peptides were filterd with 1% false discovery rate.
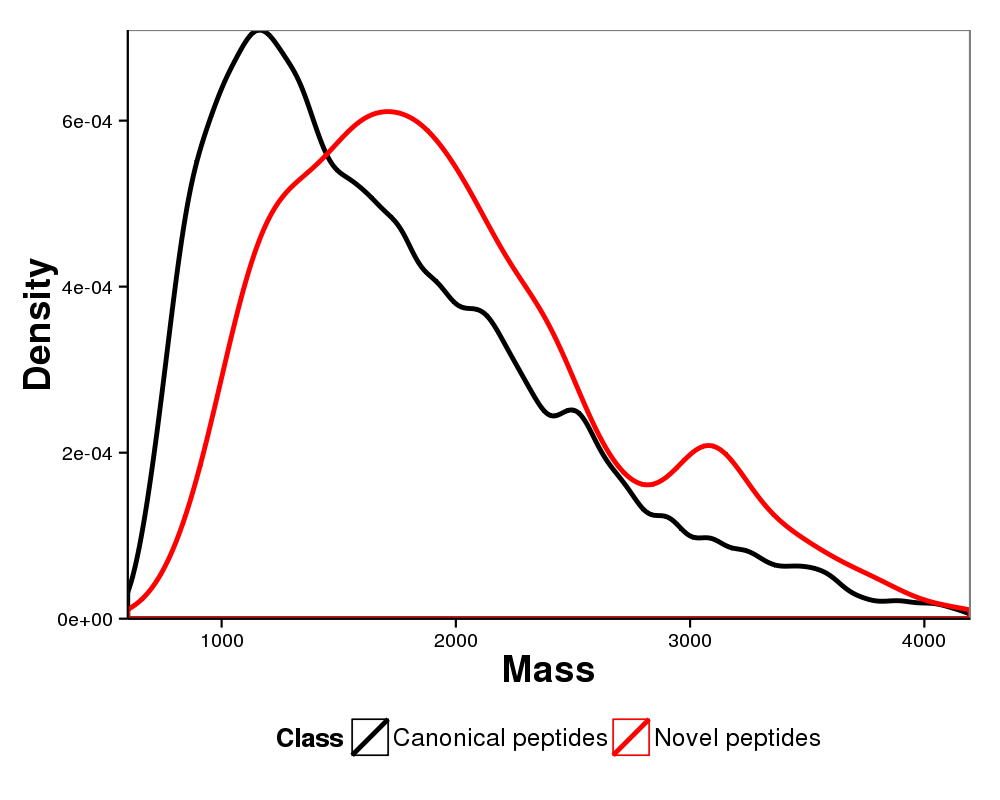
Table 1. The summary table of identification result.
| Item | Value |
|---|---|
| No. of PSMs | 224700 |
| No. of peptides | 73459 |
| No. of proteins | 8399 |
| No. of PSMs(novel peptides) | 1453 |
| No. of novel peptides | 632 |
Figure 7. The pie plot of the novel peptides
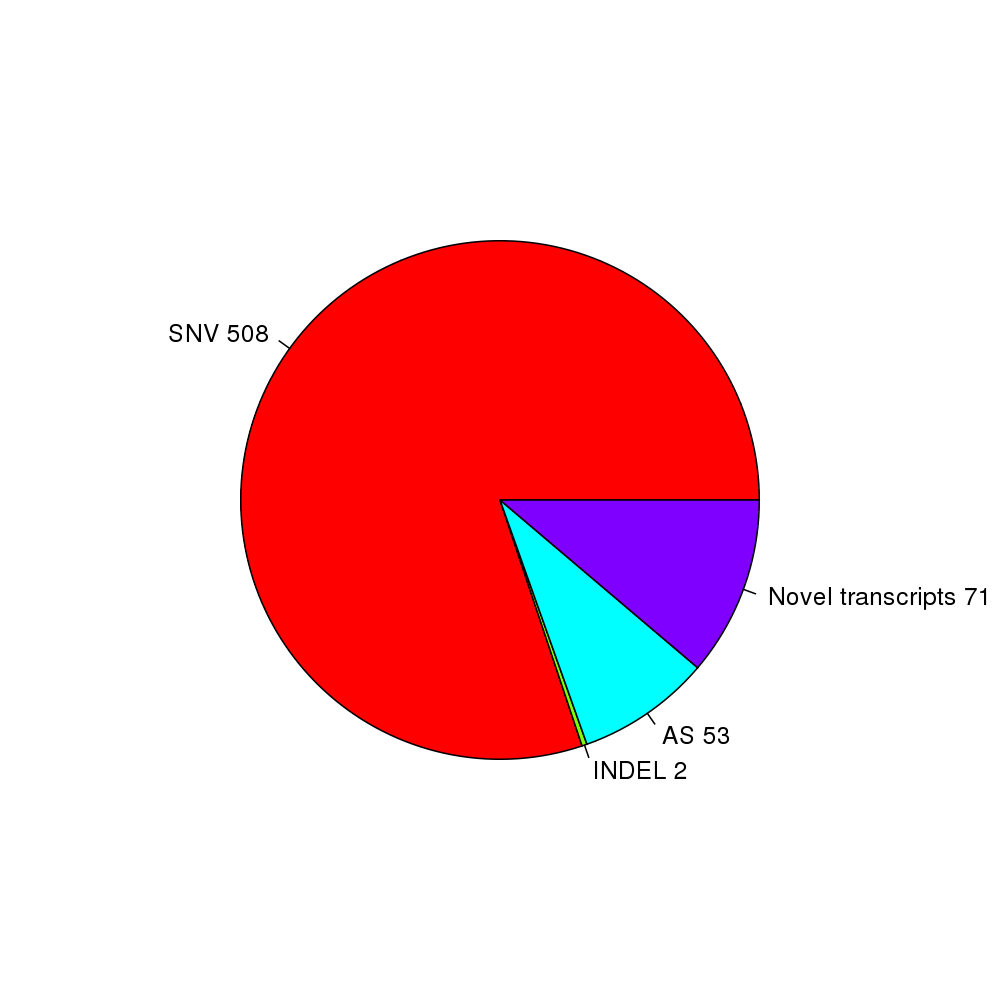
Table 2. Novel peptide identification. Click the link in the last column to view the detailed information.
| class | n | detail |
|---|---|---|
| SNV | 508 | See detail |
| INDEL | 2 | See detail |
| AS | 53 | See detail |
| Novel transcripts | 71 | See detail |
Table 3. Get Full Table Peptide identification result. Click GET FULL TABLE (in the top right of the table) to get the full result.
| index | charge | mass | delta_ppm | peptide | Qvalue |
|---|---|---|---|---|---|
| 407765 | 2 | 2500 | -2.1 | AADSQNSGEGNTGAAESSFSQEVSR | 0 |
| 407766 | 2 | 2500 | -1.1 | AADSQNSGEGNTGAAESSFSQEVSR | 0 |
| 376071 | 2 | 2200 | -0.0045 | IDTASLGDSTDSYIEVLDGSR | 0 |
| 392037 | 2 | 2300 | -2 | TMMACGGSIQTSVNALSADVLGR | 0 |
| 358782 | 2 | 2100 | -5.5 | IQAAASTPTNATAASDANTGDR | 0 |
| 368366 | 2 | 2200 | -0.068 | EQSSEAAETGVSENEENPVR | 0 |
| 368463 | 2 | 2200 | -1.3 | DGSTTAGNSSQVSDGAAAILLAR | 0 |
| 394111 | 2 | 2400 | -2.8 | TMMACGGSIQTSVNALSADVLGR | 0 |
| 403161 | 2 | 2400 | -5.6 | VQVLTAGSLMGLGDIISQQLVER | 0 |
| 396020 | 2 | 2400 | -1.4 | TMMACGGSIQTSVNALSADVLGR | 0 |
Table 4. Get Full Table Protein identification result. Click GET FULL TABLE (in the top right of the table) to get the full result.
| Accession | Mass | NumOfUniqPeps | NumOfUniqSpectra |
|---|---|---|---|
| ENSP00000444169 | 100000 | 15 | 33 |
| ENSP00000470310 | 26000 | 5 | 12 |
| ENSP00000433153 | 18000 | 1 | 1 |
| ENSP00000344002 | 290000 | 1 | 2 |
| ENSP00000351339 | 280000 | 106 | 461 |
| ENSP00000471999 | 280000 | 109 | 465 |
| ENSP00000448520 | 31000 | 13 | 39 |
| ENSP00000420315 | 39000 | 2 | 4 |
| ENSP00000304467 | 80000 | 1 | 2 |
| ENSP00000453092 | 8000 | 1 | 1 |